DurableStack

Welcome to DurableStack Observation Platform

Sign in or register to operate background jobs with real-time visibility, reliable controls, and production-ready alerting.

Sign in or create your account

Enter your work email once. Existing users continue to sign-in and new users continue to registration automatically.

Password Magic link OAuth

Go Live Quickly with .NET or Node.js

Install the SDK, register DurableStack in your host, configure storage, and start at least one worker process. Once connected, the platform ingests execution events and builds an operational history automatically.

Start with the quick-start guide, then confirm first runs in Jobs and Dashboard.
Built for Production, Not Demos

Scheduling is the easy part. Operating distributed background workloads in production is where most teams lose time.

DurableStack is built to close that gap by turning runtime events into actionable state: attempts, retries, latency, worker heartbeats, failure samples, and alert transitions. It gives developers a system-level view of job behavior without bolting together multiple tools.

See Exactly What Happened

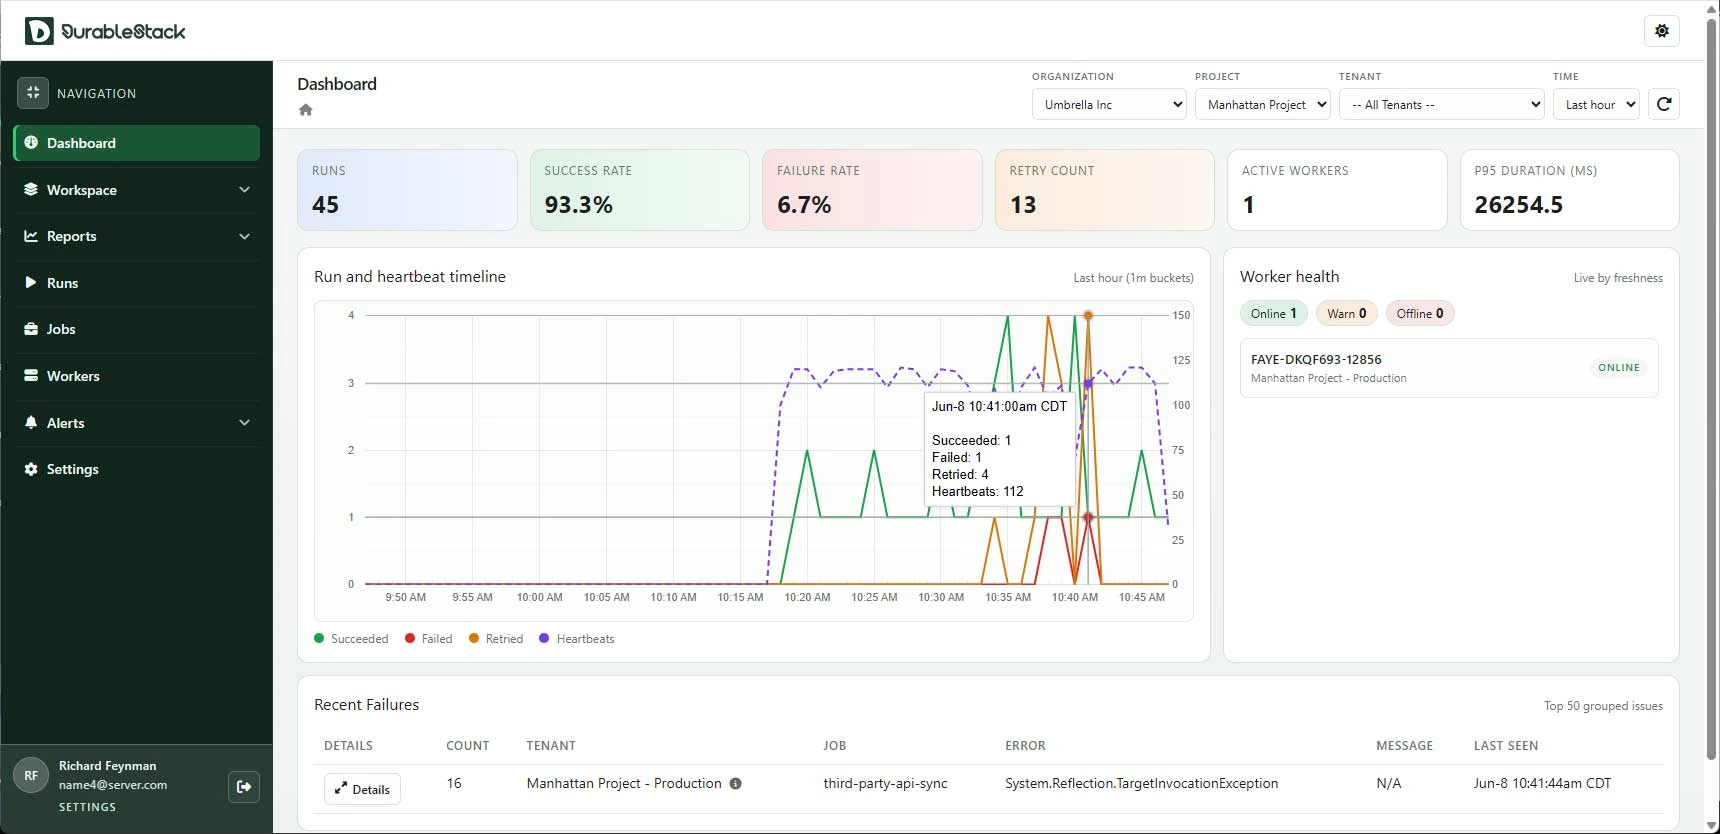
Dashboard screenshot

The dashboard is designed for investigation, not just status reporting. You can inspect run timelines, retry behavior, and worker availability in real time, then scope every view by organization, project, and tenant to isolate impact quickly.

When a job fails, failure analysis views surface the execution context you need to reproduce and fix issues without digging through unrelated logs first.

Control Jobs from the Observation UI

DurableStack is not only for monitoring. The Jobs page gives operators direct runtime controls for common interventions during incidents and maintenance windows, without redeploying code.

  • Run now: trigger immediate execution without waiting for the next schedule window.
  • Enable or disable: pause noisy or risky jobs quickly, then restore them when conditions are stable.
  • Update schedule: adjust cron timing from the platform and apply the change safely.

Turn Signals into Incidents Fast

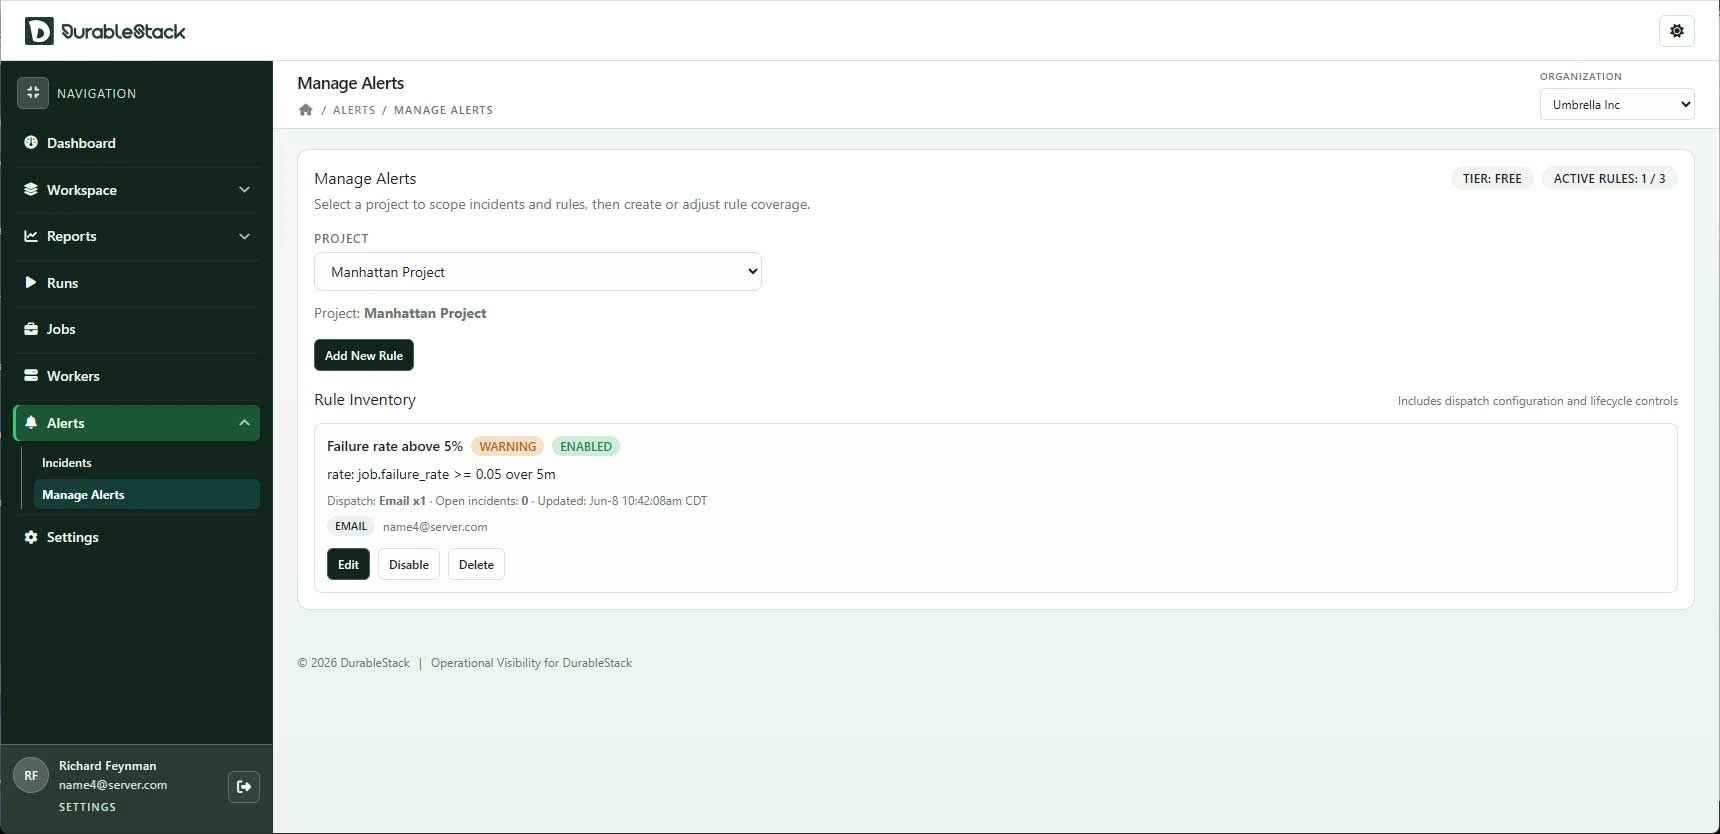
Dashboard screenshot

Alert policies let you define operational thresholds around error rates, retry saturation, worker health, and other runtime signals. When a rule opens an incident, DurableStack carries forward context about scope and severity so responders can triage immediately.

This workflow moves teams from passive monitoring to explicit incident handling with fewer false starts.

Keep Your Existing Observability Stack

DurableStack does not require replacing your current observability tooling. Execution events can be exported through OpenTelemetry and event sinks so traces, metrics, and job-level outcomes stay correlated in your existing pipeline.

You can adopt the platform incrementally while preserving established dashboards, alert destinations, and incident workflows.

Your First 10 Minutes

Use this sequence to validate the full loop in a development environment:

  1. Connect the runtime and start a worker.
  2. Trigger a recurring or delayed job.
  3. Confirm run and worker state in the dashboard.
  4. Create an alert rule and validate incident routing.

Ready to start? Follow the DurableStack quick-start and complete your first end-to-end run.